For many people, summer holiday is not a necessity, but a must. Whether it’s a beach holiday, a road trip, an adrenaline-filled adventure, or an exotic vacation in the Far East, summer seems like the perfect time to get away from the hectic rush of everyday life to relax, unwind and replenish energy.
Most of us can relate to the feeling of excitement and anticipation prior to a holiday, and equally, many of us have experienced first-hand the disappointment at the airport when we realise that our flight has been delayed, or worse, cancelled!
Summer flight delays or cancellations can be a real frustration to holidaymakers. Using data from FlightStats, Columbus Direct has found out that last year’s flight cancellations from UK departure airports increased by almost a quarter between July and September compared to the same period in 2014. Extensive flight delays of two hours or more also increased by 10% across the peak summer holiday period.
Of course, airports and airlines aren’t always the one to blame for flight delays and cancellations. There are often external factors involved such as inclement weather conditions or industrial actions that are beyond the control of airport and airline operators.
Waiting for delayed flights in crowded and busy airports can be quite stressful, especially if you are travelling with children. Columbus Direct has therefore reduced its threshold for complementary airport lounge access for announced flight delays from the usual two hours to one hour in August for its customers. Policyholders can access one of our 500 lounges worldwide with up to four of their fellow travellers and take advantage of facilities such as Wi-Fi, food and drink and relaxing comfortable surroundings.
Greatest number of delayed and cancelled summer flights at London main airports
If last year’s flight cancellations and delays are to repeat again this summer, travellers should be prepared for long waits and delays. Our analysis shows that almost 1,300 UK departure flights were cancelled during last summer holiday season. In total, travellers spent more than 16,067 hours waiting for delayed flights to depart UK airports, with 1,352 flights delayed by three hours or more.
London Gatwick and London Heathrow witnessed the largest volume of passenger disruption, with the greatest number of delayed and cancelled flights. London Gatwick saw 3,056 flights delayed by over an hour in the peak summer season, eight per cent of all departures. London Heathrow saw 2,663 flights delayed by at least an hour over the same period (4.5%). It’s important to point out though that these airports do boast by far and away the largest number of UK holidaymakers seeking to jet away each summer.
Seventeen UK airports had over 100 flights delayed by at least an hour, including the likes of Aberdeen, Newcastle, Bristol and Nottingham. London Heathrow saw the far greatest number of flights cancelled of all UK airports, with 383 scheduled flights not taking off at all. London City saw 121 flights cancelled during the peak summer holiday period and Manchester saw 84 flights grounded.
The table below shows the 20 UK airports with more than 1000 flight departure coverage between July-Sept 2015 and their flight cancellations and delays:
| Airport | Flights with departure coverage | No. of Cancelled flights | % of Cancelled flights | No. of 60+ minute delays | % of 60+ minute delays | No. of 120+ minute delays | % of 120+ minute delays |
|---|---|---|---|---|---|---|---|
| Heathrow | 58778 | 383 | 0.7% | 2663 | 4.5% | 636 | 1.1% |
| Gatwick | 38618 | 70 | 0.2% | 3056 | 7.9% | 800 | 2.1% |
| Manchester | 22444 | 84 | 0.4% | 1726 | 7.7% | 560 | 2.5% |
| Edinburgh | 12422 | 60 | 0.5% | 514 | 4.1% | 113 | 0.9% |
| Glasgow | 9676 | 63 | 0.7% | 617 | 6.4% | 240 | 2.5% |
| London City | 6463 | 121 | 1.9% | 274 | 4.2% | 59 | 0.9% |
| Nottingham | 5549 | 17 | 0.3% | 210 | 3.8% | 53 | 1.0% |
| Luton | 5345 | 12 | 0.2% | 267 | 5.0% | 59 | 1.1% |
| Belfast | 5053 | 39 | 0.8% | 233 | 4.6% | 31 | 0.6% |
| Bristol | 4700 | 17 | 0.4% | 219 | 4.7% | 83 | 1.8% |
| Belfast | 4406 | 1 | 0.0% | 230 | 5.2% | 70 | 1.6% |
| Birmingham | 4013 | 34 | 0.8% | 149 | 3.7% | 56 | 1.4% |
| Aberdeen | 3598 | 51 | 1.4% | 100 | 2.8% | 29 | 0.8% |
| Stansted | 3285 | 21 | 0.6% | 201 | 6.1% | 87 | 2.6% |
| Newcastle | 3122 | 14 | 0.4% | 132 | 4.2% | 56 | 1.8% |
| Liverpool | 2174 | 12 | 0.6% | 82 | 3.8% | 20 | 0.9% |
| Isle Of Man | 1635 | 22 | 1.3% | 153 | 9.4% | 38 | 2.3% |
| Jersey | 1196 | 17 | 1.4% | 59 | 4.9% | 20 | 1.7% |
| Orkney Island | 1136 | 18 | 1.6% | 100 | 8.8% | 29 | 2.6% |
| Inverness | 1114 | 9 | 0.8% | 89 | 8.0% | 29 | 2.6% |
Source: Columbus Direct’s analysis of FlightStats data
Which airlines suffered the least flight disruptions?
When it comes to airlines (those with more than 1500 flights scheduled in the summer period), Lufthansa had the least flight delays of more than three hours in last year’s summer season – just 2 out of its 3,765 flights. SAS was runner-up, followed by Swiss and Air France. If last year’s flight data are of any indication, the ten airlines below are least likely to keep travellers waiting for more than three hours for their summer flights:
- Lufthansa
- SAS
- SWISS
- Air France
- Monarch Airlines
- Aer Lingus
- KLM
- Germanwings
- British Airways
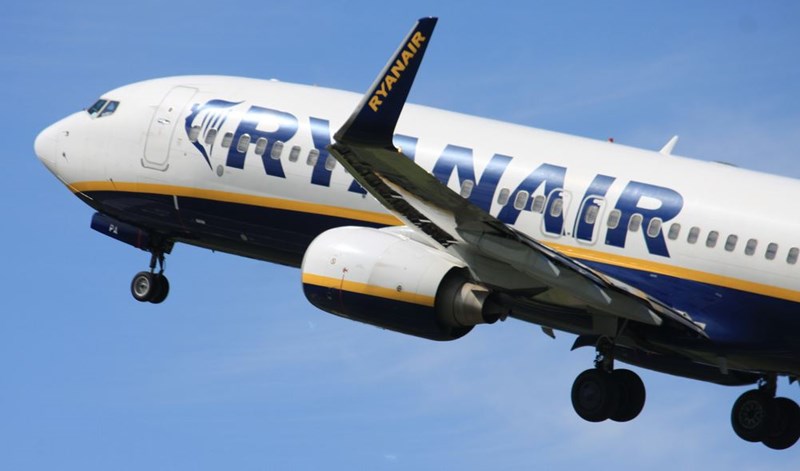
- Ryanair
In addition to delayed flights, around 0.6% of summer flights were cancelled. Given that there were in total 202,363 UK departure flights, the proportion thankfully wasn’t too significant. Ryanair and Monarch Airlines both topped the chart with no flight cancellations at all. Emirates was a close second, followed by Thomson and Thomas Cook Airlines. Going by last summer’s figures, the chance of your flights being grounded should be low if you are jetting off with one of these 10 airlines:
- Ryanair
- Monarch Airlines
- Emirates
- Thomson
- Thomas Cook Airlines
- Aer Lingus
- Norwegian Air Shuttle
- Virgin Atlantic
- easyJet
- Jet2
Full data on airline cancellations and delays between July and September 2015 are provided below:
| Airline | Flights with departure coverage | No. of Cancelled flights | % of Cancelled flights | No. of 60+ minute delays | % of 60+ minute delays | No. of 120+ minute delays | % of 120+ minute delays |
|---|---|---|---|---|---|---|---|
| British Airways | 49,635 | 461 | 0.9% | 2,383 | 4.8% | 512 | 1.0% |
| easyJet | 44,607 | 74 | 0.2% | 2,899 | 6.5% | 748 | 1.7% |
| Flybe | 21,220 | 312 | 1.5% | 1,710 | 8.1% | 521 | 2.5% |
| Aer Lingus | 7,082 | 9 | 0.1% | 246 | 3.5% | 64 | 0.9% |
| Ryanair | 6,805 | 0 | 0.0% | 231 | 3.4% | 41 | 0.6% |
| Thomas Cook Airlines | 5,977 | 7 | 0.1% | 684 | 11.4% | 443 | 7.4% |
| KLM | 5,612 | 34 | 0.6% | 81 | 1.4% | 30 | 0.5% |
| Thomson | 5,297 | 4 | 0.1% | 421 | 7.9% | 106 | 2.0% |
| Virgin Atlantic | 4,525 | 7 | 0.2% | 220 | 4.9% | 73 | 1.6% |
| Jet2 | 4,208 | 7 | 0.2% | 229 | 5.4% | 40 | 1.0% |
| Lufthansa | 3,765 | 47 | 1.2% | 95 | 2.5% | 6 | 0.2% |
| Norwegian Air Shuttle | 3,324 | 5 | 0.2% | 219 | 6.6% | 63 | 1.9% |
| Monarch Airlines | 2,957 | 0 | 0.0% | 111 | 3.8% | 28 | 0.9% |
| Germanwings | 2,679 | 30 | 1.1% | 183 | 6.8% | 39 | 1.5% |
| SAS | 2,400 | 14 | 0.6% | 49 | 2.0% | 8 | 0.3% |
| United Airlines | 2,341 | 46 | 2.0% | 135 | 5.8% | 51 | 2.2% |
| Air France | 2,027 | 4 | 0.2% | 38 | 1.9% | 8 | 0.4% |
| SWISS | 1,910 | 15 | 0.8% | 87 | 4.6% | 10 | 0.5% |
| American Airlines | 1,659 | 15 | 0.9% | 79 | 4.8% | 32 | 1.9% |
| Emirates | 1,534 | 1 | 0.1% | 47 | 3.1% | 9 | 0.6% |
| Delta Air Lines | 1,191 | 7 | 0.6% | 40 | 3.4% | 10 | 0.8% |
| Air Canada | 1,146 | 7 | 0.6% | 62 | 5.4% | 27 | 2.4% |
| Vueling | 1,087 | 3 | 0.3% | 143 | 13.2% | 44 | 4.0% |
| TAP Portugal | 1,038 | 0 | 0.0% | 41 | 3.9% | 8 | 0.8% |
| Aurigny Air Services | 855 | 26 | 3.0% | 84 | 9.8% | 36 | 4.2% |
| Qatar Airways | 784 | 2 | 0.3% | 13 | 1.7% | 2 | 0.3% |
| Alitalia | 716 | 5 | 0.7% | 50 | 7.0% | 13 | 1.8% |
| Cityjet | 705 | 14 | 2.0% | 20 | 2.8% | 4 | 0.6% |
| Turkish Airlines | 702 | 0 | 0.0% | 31 | 4.4% | 2 | 0.3% |
| Loganair | 672 | 41 | 6.1% | 31 | 4.6% | 4 | 0.6% |
| Finnair | 637 | 0 | 0.0% | 6 | 0.9% | 0 | 0.0% |
| Germania | 617 | 0 | 0.0% | 68 | 11.0% | 25 | 4.1% |
| US Airways | 551 | 5 | 0.9% | 61 | 11.1% | 27 | 4.9% |
| Etihad Airways | 540 | 0 | 0.0% | 50 | 9.3% | 3 | 0.6% |
| Cathay Pacific | 507 | 0 | 0.0% | 22 | 4.3% | 3 | 0.6% |
| Icelandair | 502 | 0 | 0.0% | 30 | 6.0% | 4 | 0.8% |
| Singapore Airlines | 460 | 0 | 0.0% | 4 | 0.9% | 2 | 0.4% |
| Aegean Airlines | 433 | 0 | 0.0% | 15 | 3.5% | 2 | 0.5% |
| Austrian | 424 | 3 | 0.7% | 13 | 3.1% | 2 | 0.5% |
| Air Malta | 421 | 0 | 0.0% | 14 | 3.3% | 5 | 1.2% |
| Air Transat | 415 | 0 | 0.0% | 21 | 5.1% | 8 | 1.9% |
| Wideroe | 411 | 3 | 0.7% | 3 | 0.7% | 0 | 0.0% |
| Air India | 366 | 0 | 0.0% | 39 | 10.7% | 26 | 7.1% |
| El Al | 310 | 0 | 0.0% | 17 | 5.5% | 2 | 0.6% |
| Brussels Airlines | 298 | 2 | 0.7% | 24 | 8.1% | 1 | 0.3% |
| Jet Airways (India) | 273 | 0 | 0.0% | 8 | 2.9% | 1 | 0.4% |
| Aeroflot | 269 | 2 | 0.7% | 8 | 3.0% | 1 | 0.4% |
| Pakistan International Airlines | 266 | 8 | 3.0% | 50 | 18.8% | 22 | 8.3% |
| LOT - Polish Airlines | 262 | 1 | 0.4% | 27 | 10.3% | 15 | 5.7% |
| Heli Air Monaco | 257 | 0 | 0.0% | 5 | 1.9% | 0 | 0.0% |
| EgyptAir | 257 | 0 | 0.0% | 24 | 9.3% | 3 | 1.2% |
| Saudia | 235 | 0 | 0.0% | 7 | 3.0% | 2 | 0.9% |
| Eastern Airways | 202 | 35 | 17.3% | 7 | 3.5% | 0 | 0.0% |
| Royal Air Maroc | 199 | 0 | 0.0% | 11 | 5.5% | 0 | 0.0% |
| Malaysia Airlines | 184 | 0 | 0.0% | 6 | 3.3% | 2 | 1.1% |
| Air China | 183 | 1 | 0.5% | 7 | 3.8% | 2 | 1.1% |
| Middle East Airlines | 183 | 0 | 0.0% | 10 | 5.5% | 3 | 1.6% |
| Qantas | 181 | 0 | 0.0% | 8 | 4.4% | 4 | 2.2% |
| South African Airways | 180 | 0 | 0.0% | 3 | 1.7% | 1 | 0.6% |
| Air Europa | 179 | 0 | 0.0% | 13 | 7.3% | 2 | 1.1% |
| UIA | 178 | 1 | 0.6% | 18 | 10.1% | 2 | 1.1% |
| bmi Regional | 173 | 5 | 2.9% | 3 | 1.7% | 0 | 0.0% |
| Wizz Air | 142 | 3 | 2.1% | 11 | 7.7% | 2 | 1.4% |
| Croatia Airlines | 141 | 0 | 0.0% | 26 | 18.4% | 3 | 2.1% |
| Air Baltic | 131 | 0 | 0.0% | 6 | 4.6% | 0 | 0.0% |
| Meridiana | 121 | 0 | 0.0% | 8 | 6.6% | 4 | 3.3% |
| Pegasus | 117 | 0 | 0.0% | 19 | 16.2% | 1 | 0.9% |
| Condor | 105 | 1 | 1.0% | 20 | 19.0% | 12 | 11.4% |
| WOW Air | 103 | 0 | 0.0% | 4 | 3.9% | 1 | 1.0% |
| China Southern Airlines | 96 | 0 | 0.0% | 2 | 2.1% | 0 | 0.0% |
| JAL | 92 | 0 | 0.0% | 0 | 0.0% | 0 | 0.0% |
| ANA | 92 | 0 | 0.0% | 1 | 1.1% | 0 | 0.0% |
| Royal Brunei Airlines | 92 | 0 | 0.0% | 1 | 1.1% | 0 | 0.0% |
| TAM Linhas Aereas | 92 | 0 | 0.0% | 1 | 1.1% | 0 | 0.0% |
| Asiana Airlines | 92 | 0 | 0.0% | 2 | 2.2% | 1 | 1.1% |
| Kenya Airways | 92 | 1 | 1.1% | 2 | 2.2% | 1 | 1.1% |
| WestJet | 92 | 0 | 0.0% | 2 | 2.2% | 2 | 2.2% |
| Thai Airways International | 92 | 0 | 0.0% | 6 | 6.5% | 5 | 5.4% |
| EVA Air | 91 | 0 | 0.0% | 3 | 3.3% | 0 | 0.0% |
| AVIANCA | 90 | 0 | 0.0% | 4 | 4.4% | 2 | 2.2% |
| Air New Zealand | 89 | 0 | 0.0% | 0 | 0.0% | 0 | 0.0% |
| Bulgaria Air | 89 | 0 | 0.0% | 12 | 13.5% | 4 | 4.5% |
| Korean Air | 88 | 0 | 0.0% | 0 | 0.0% | 0 | 0.0% |
| Ethiopian Airlines | 88 | 0 | 0.0% | 2 | 2.3% | 0 | 0.0% |
| China Eastern Airlines | 88 | 1 | 1.1% | 7 | 8.0% | 4 | 4.5% |
| SriLankan Airlines | 77 | 0 | 0.0% | 4 | 5.2% | 1 | 1.3% |
| Luxair | 69 | 2 | 2.9% | 0 | 0.0% | 0 | 0.0% |
| CSA | 68 | 0 | 0.0% | 4 | 5.9% | 2 | 2.9% |
| Aeromexico | 65 | 0 | 0.0% | 0 | 0.0% | 0 | 0.0% |
| Vietnam Airlines | 63 | 0 | 0.0% | 8 | 12.7% | 6 | 9.5% |
| Belavia | 59 | 0 | 0.0% | 8 | 13.6% | 1 | 1.7% |
| SmartWings | 57 | 0 | 0.0% | 16 | 28.1% | 5 | 8.8% |
| Tunisair | 56 | 0 | 0.0% | 21 | 37.5% | 6 | 10.7% |
| Philippine Airlines | 52 | 0 | 0.0% | 1 | 1.9% | 0 | 0.0% |
| Montenegro Airlines | 48 | 0 | 0.0% | 1 | 2.1% | 0 | 0.0% |
| Air Mauritius | 47 | 1 | 2.1% | 4 | 8.5% | 0 | 0.0% |
| Caribbean Airlines | 47 | 0 | 0.0% | 2 | 4.3% | 1 | 2.1% |
| Garuda Indonesia | 46 | 0 | 0.0% | 1 | 2.2% | 1 | 2.2% |
| Adria Airways | 43 | 0 | 0.0% | 1 | 2.3% | 1 | 2.3% |
| Air Astana | 39 | 0 | 0.0% | 2 | 5.1% | 0 | 0.0% |
| Iraqi Airways | 39 | 3 | 7.7% | 4 | 10.3% | 1 | 2.6% |
| Air Berlin | 30 | 0 | 0.0% | 1 | 3.3% | 0 | 0.0% |
| Air Arabia Maroc | 27 | 0 | 0.0% | 4 | 14.8% | 1 | 3.7% |
| Atlantic Airways | 24 | 0 | 0.0% | 1 | 4.2% | 0 | 0.0% |
| Blue Islands | 23 | 16 | 69.6% | 0 | 0.0% | 0 | 0.0% |
| SkyWork Airlines | 17 | 1 | 5.9% | 0 | 0.0% | 0 | 0.0% |
| Gulf Air | 17 | 0 | 0.0% | 4 | 23.5% | 1 | 5.9% |
| SATA Internacional | 13 | 0 | 0.0% | 2 | 15.4% | 0 | 0.0% |
| Transaero Airlines | 2 | 2 | 100.0% | 0 | 0.0% | 0 | 0.0% |
| Estonian Air | 2 | 0 | 0.0% | 1 | 50.0% | 1 | 50.0% |
| Aerolineas Argentinas | 1 | 1 | 100.0% | 0 | 0.0% | 0 | 0.0% |
| Air Moldova | 1 | 1 | 100.0% | 0 | 0.0% | 0 | 0.0% |
| VLM | 1 | 1 | 100.0% | 0 | 0.0% | 0 | 0.0% |
| Full year | 202,361 | 1,297 | 0.6% | 11,493 | 5.7% | 3,222 | 1.6% |
Source: Columbus Direct’s analysis of FlightStats data